NEW RELIC: AI LOGS ASSISTANT
NEW RELIC: AI LOGS ASSISTANT
A NEW AI-POWERED LOG SUMMARIZATION CAPABILITY PROVIDING USERS WITH AN INSTANT, INTELLIGENT ANALYSIS.

AI Logs Assistant
overview
When a Site Reliability Engineer (SRE) gets paged for an active incident, the clock starts ticking. The current workflow forces them to context-switch from the alert notification into the Logs UI or other curated dashboards, where they are confronted with a wall of data. The immediate challenge is not just the volume of logs, but the need to rapidly form a hypothesis under pressure. They must manually adjust time window, remove query filter to see broader context, and visually scan for patterns, all while the system is failing.
SOLUTION
Instead of starting with raw data, the SRE starts with an answer. By automatically analyzing the logs associated with the alert, the AI provides actionable insights and usable information. It surfaces the most critical information such as the specific error message, the specific services that’s failing, related upstream and downstream dependencies, and a timeline of the anomaly, all while keeping the user on the original Alert Issue page.
IMPACT
User Value:
This eliminates the initial, time-consuming, manual investigation and allows the SRE to focus immediately on resolution.
FEATURES
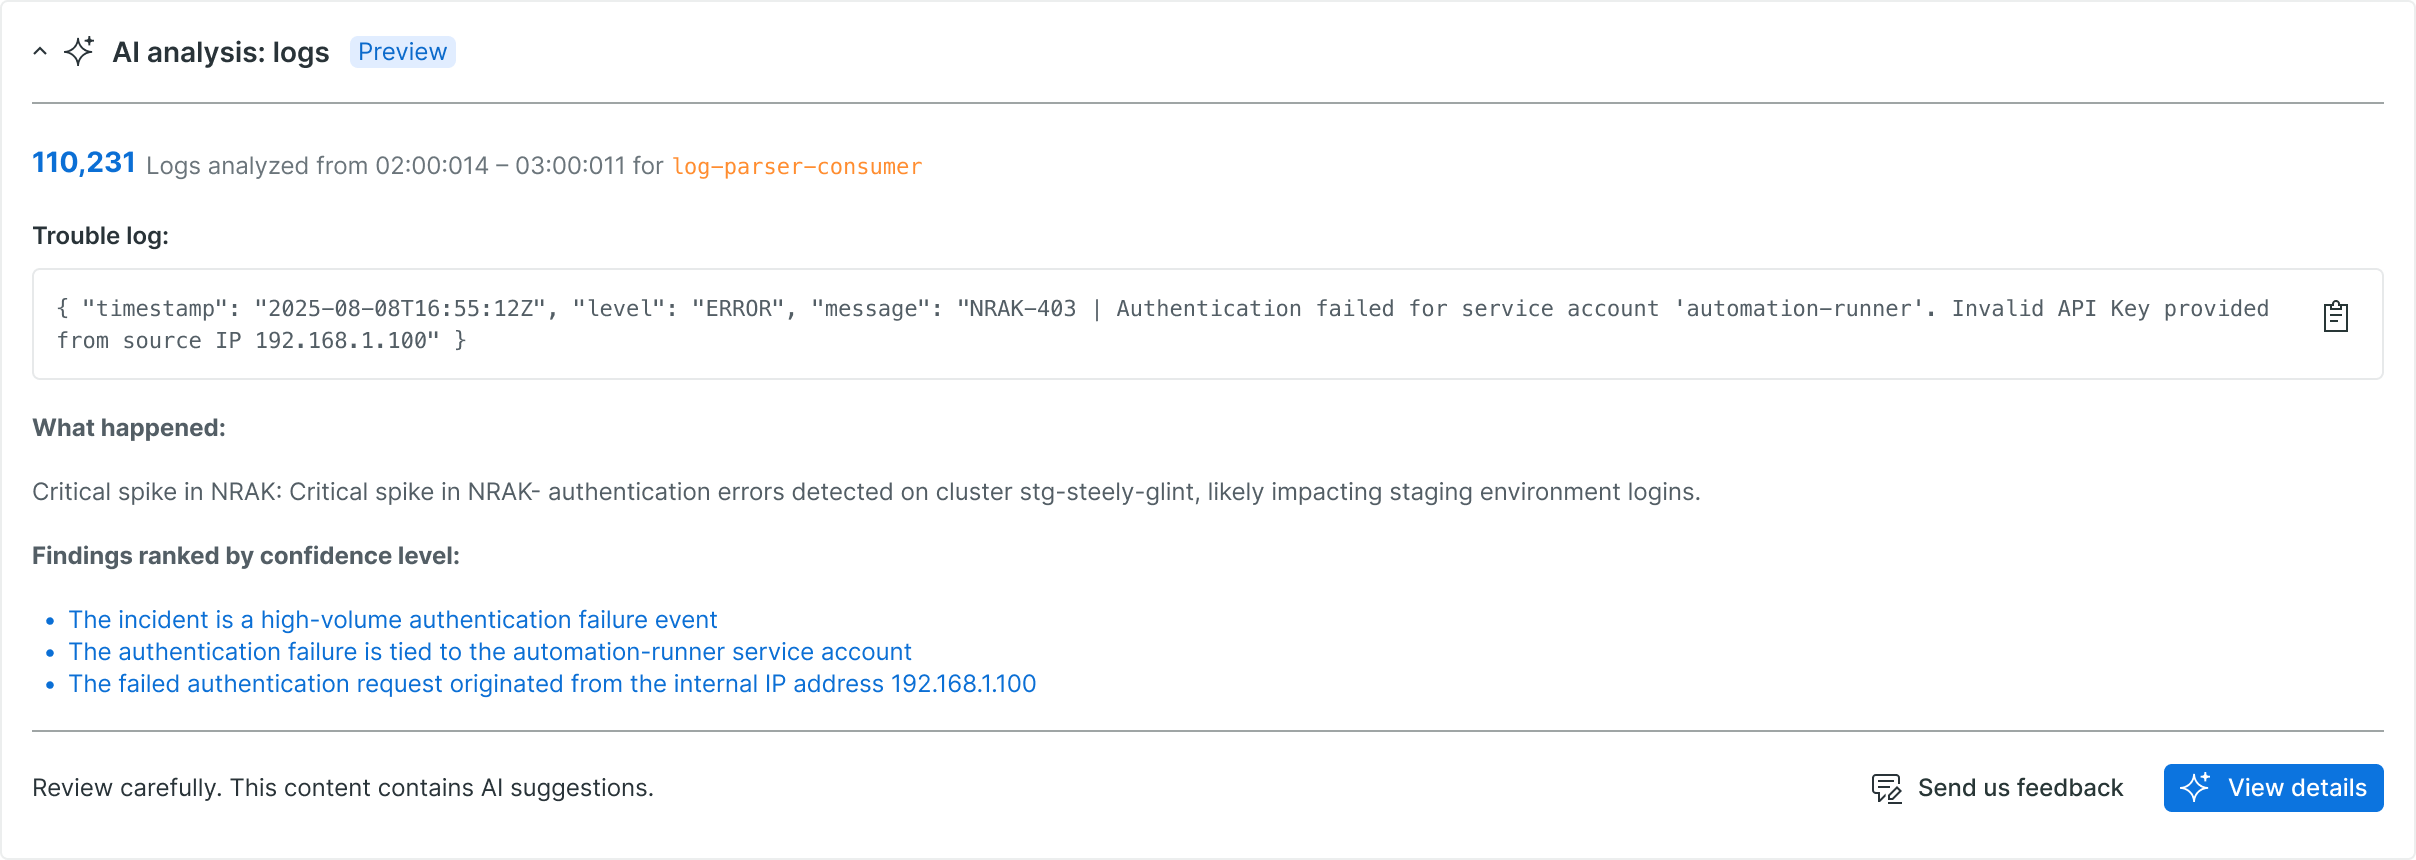
Instantaneous key findings:
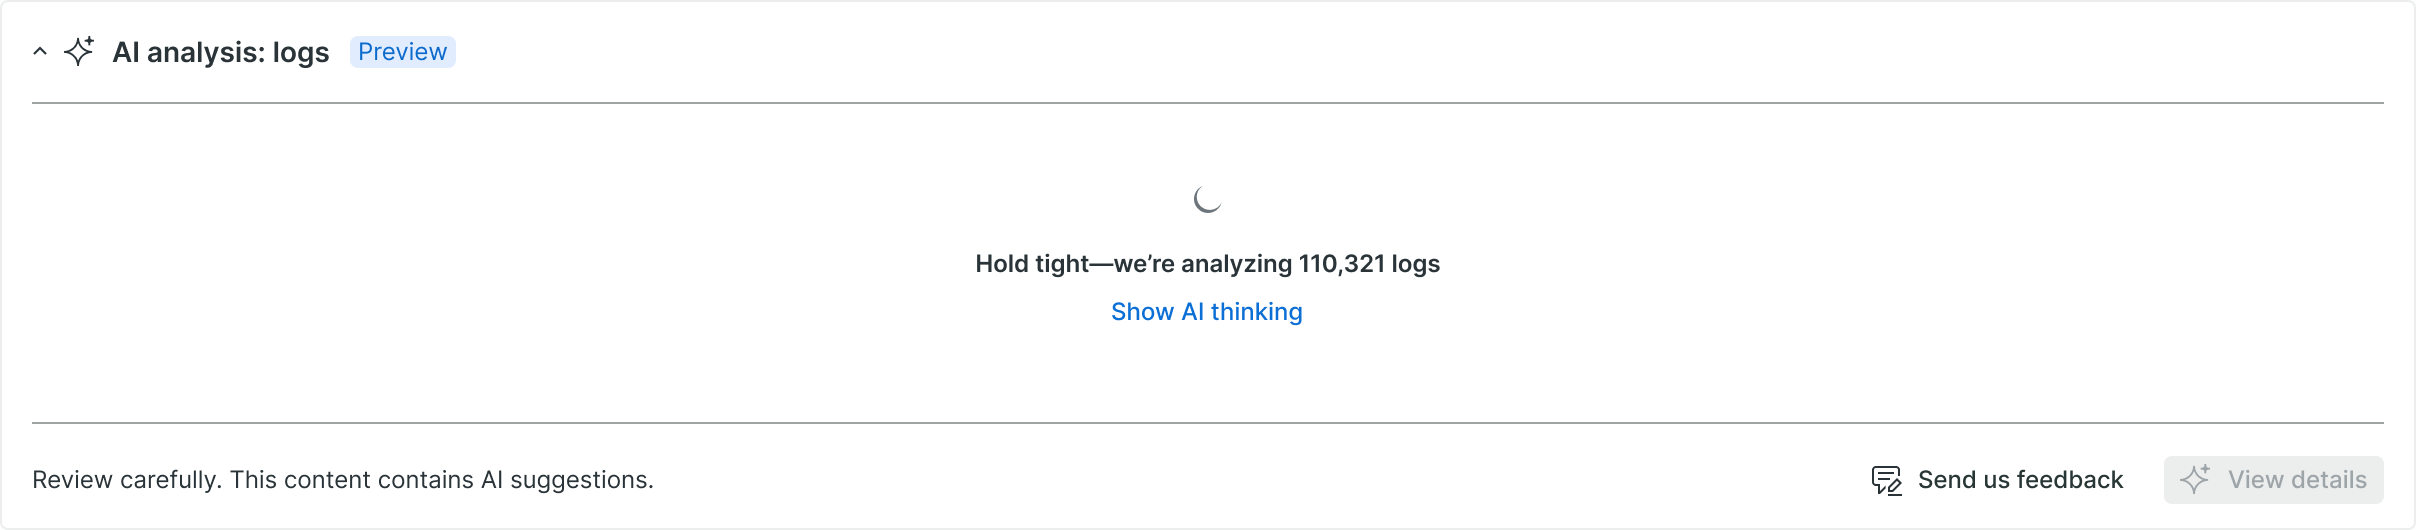
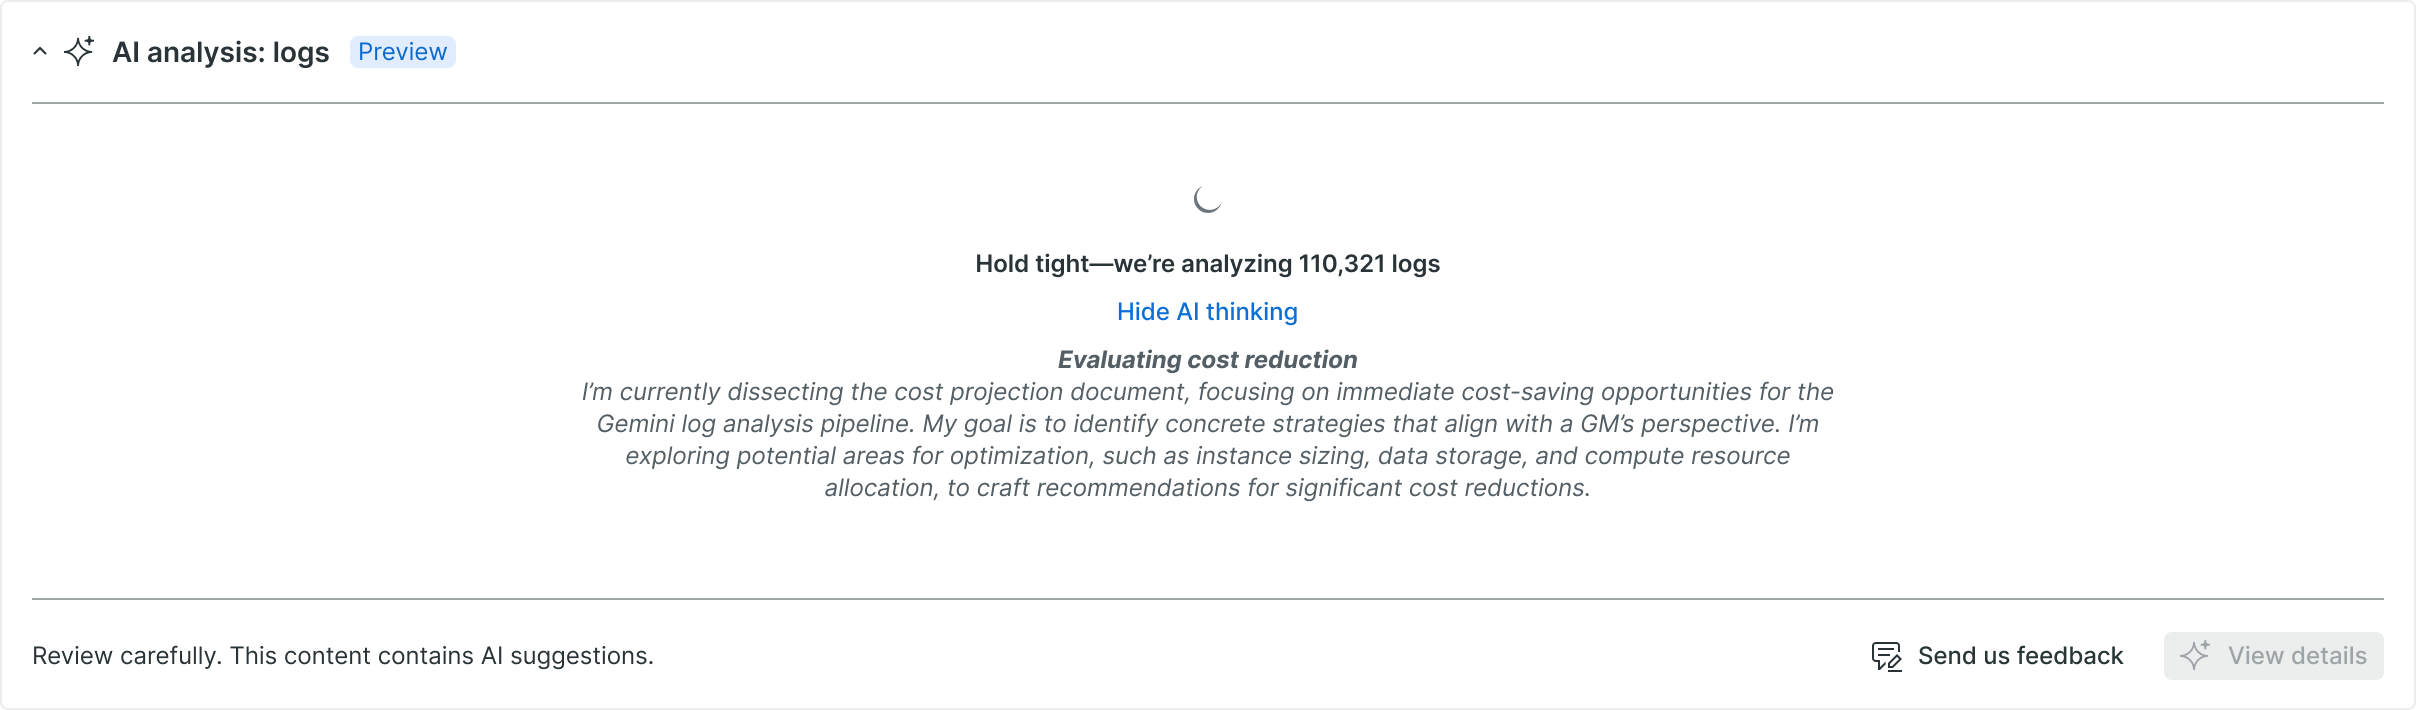
Upon landing on the alert issue page, the user is immediately greeted with a new “AI Contextual Log Summary” panel. This panel automatically contains a summary of the logs from a contextual time window around the incident (e.g., 30 minutes before and 5 minutes after).
Prescriptive Insights:
This summary is not general; it is tailored to the incident. It provides:
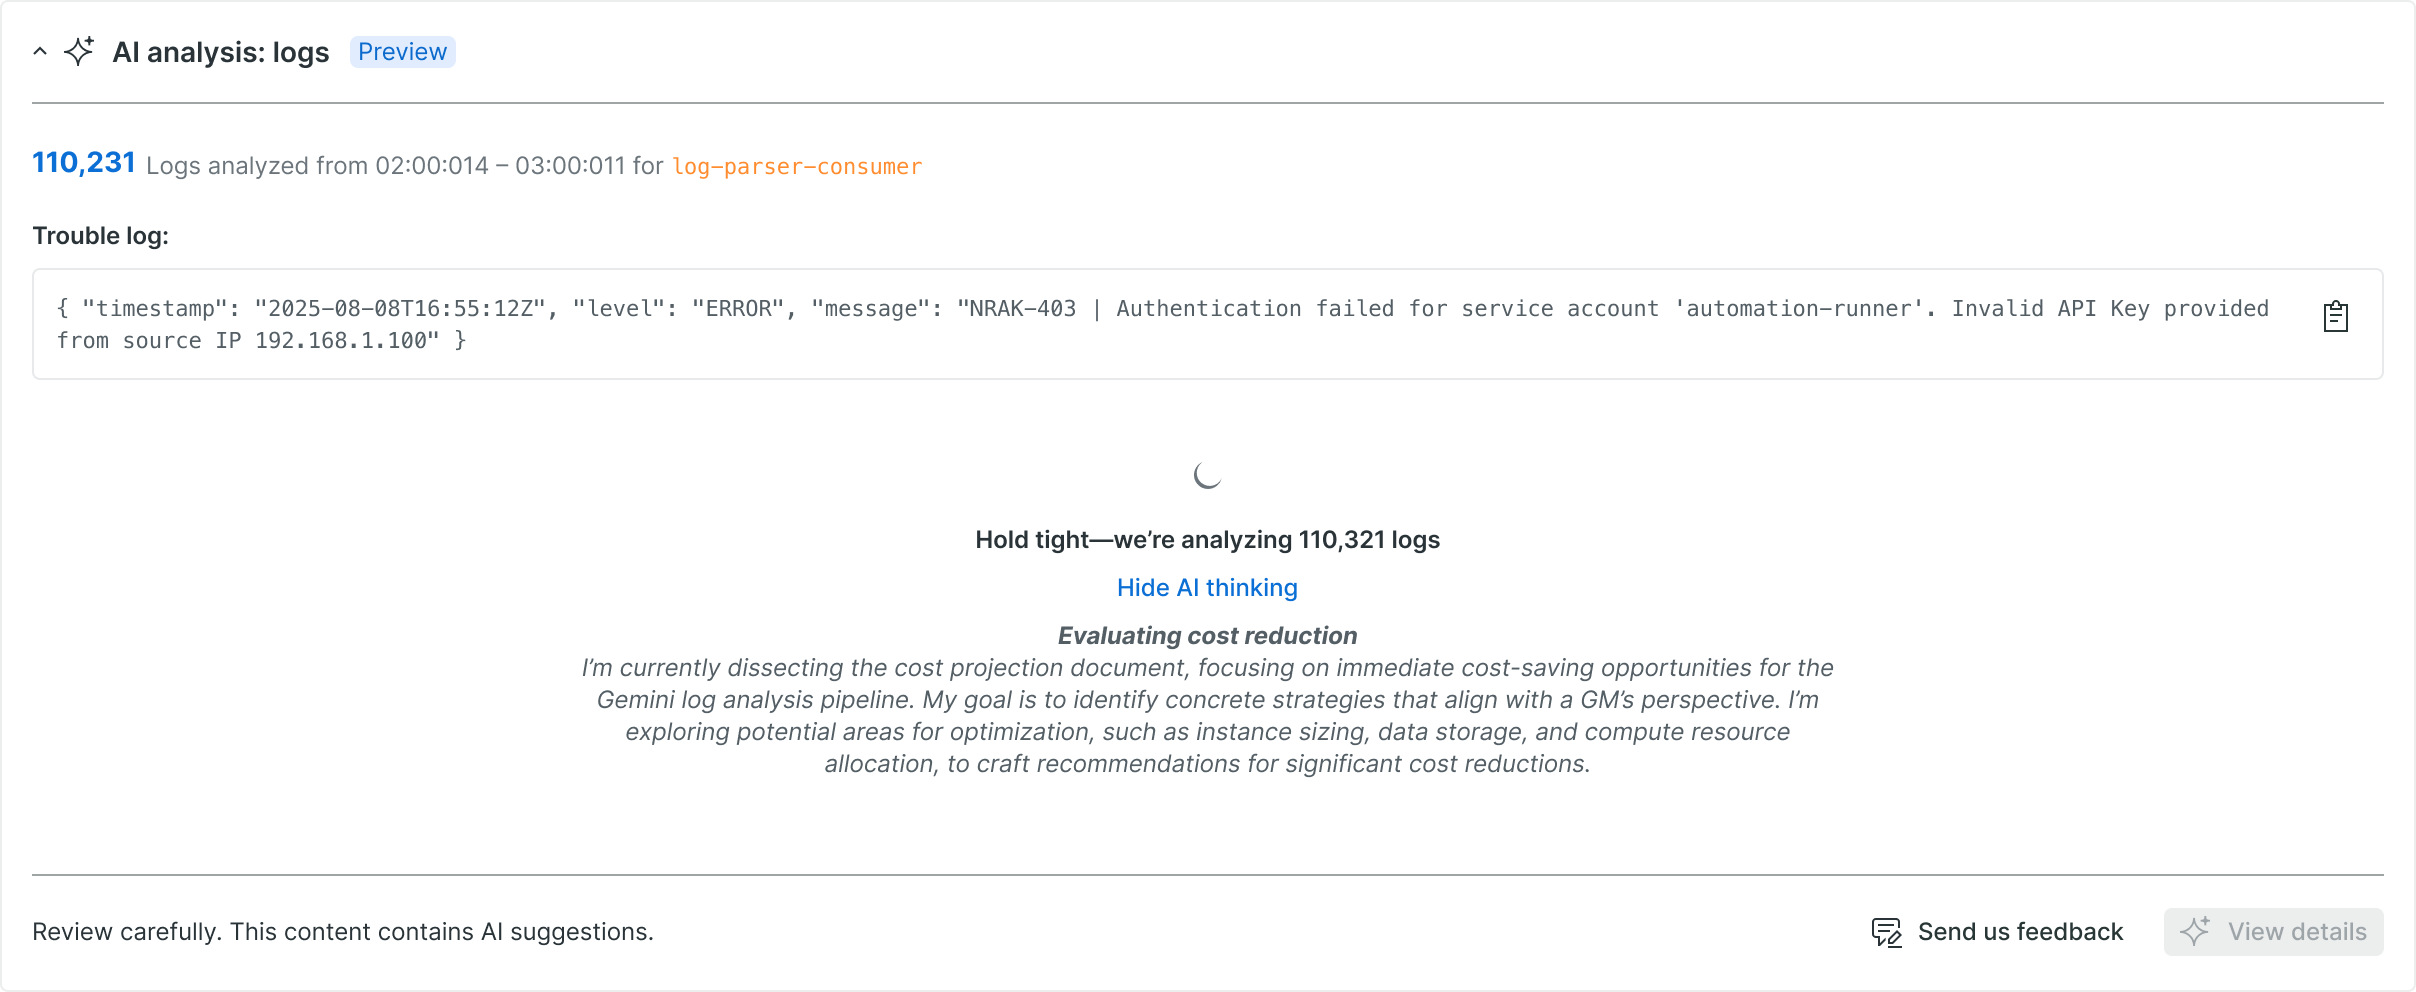
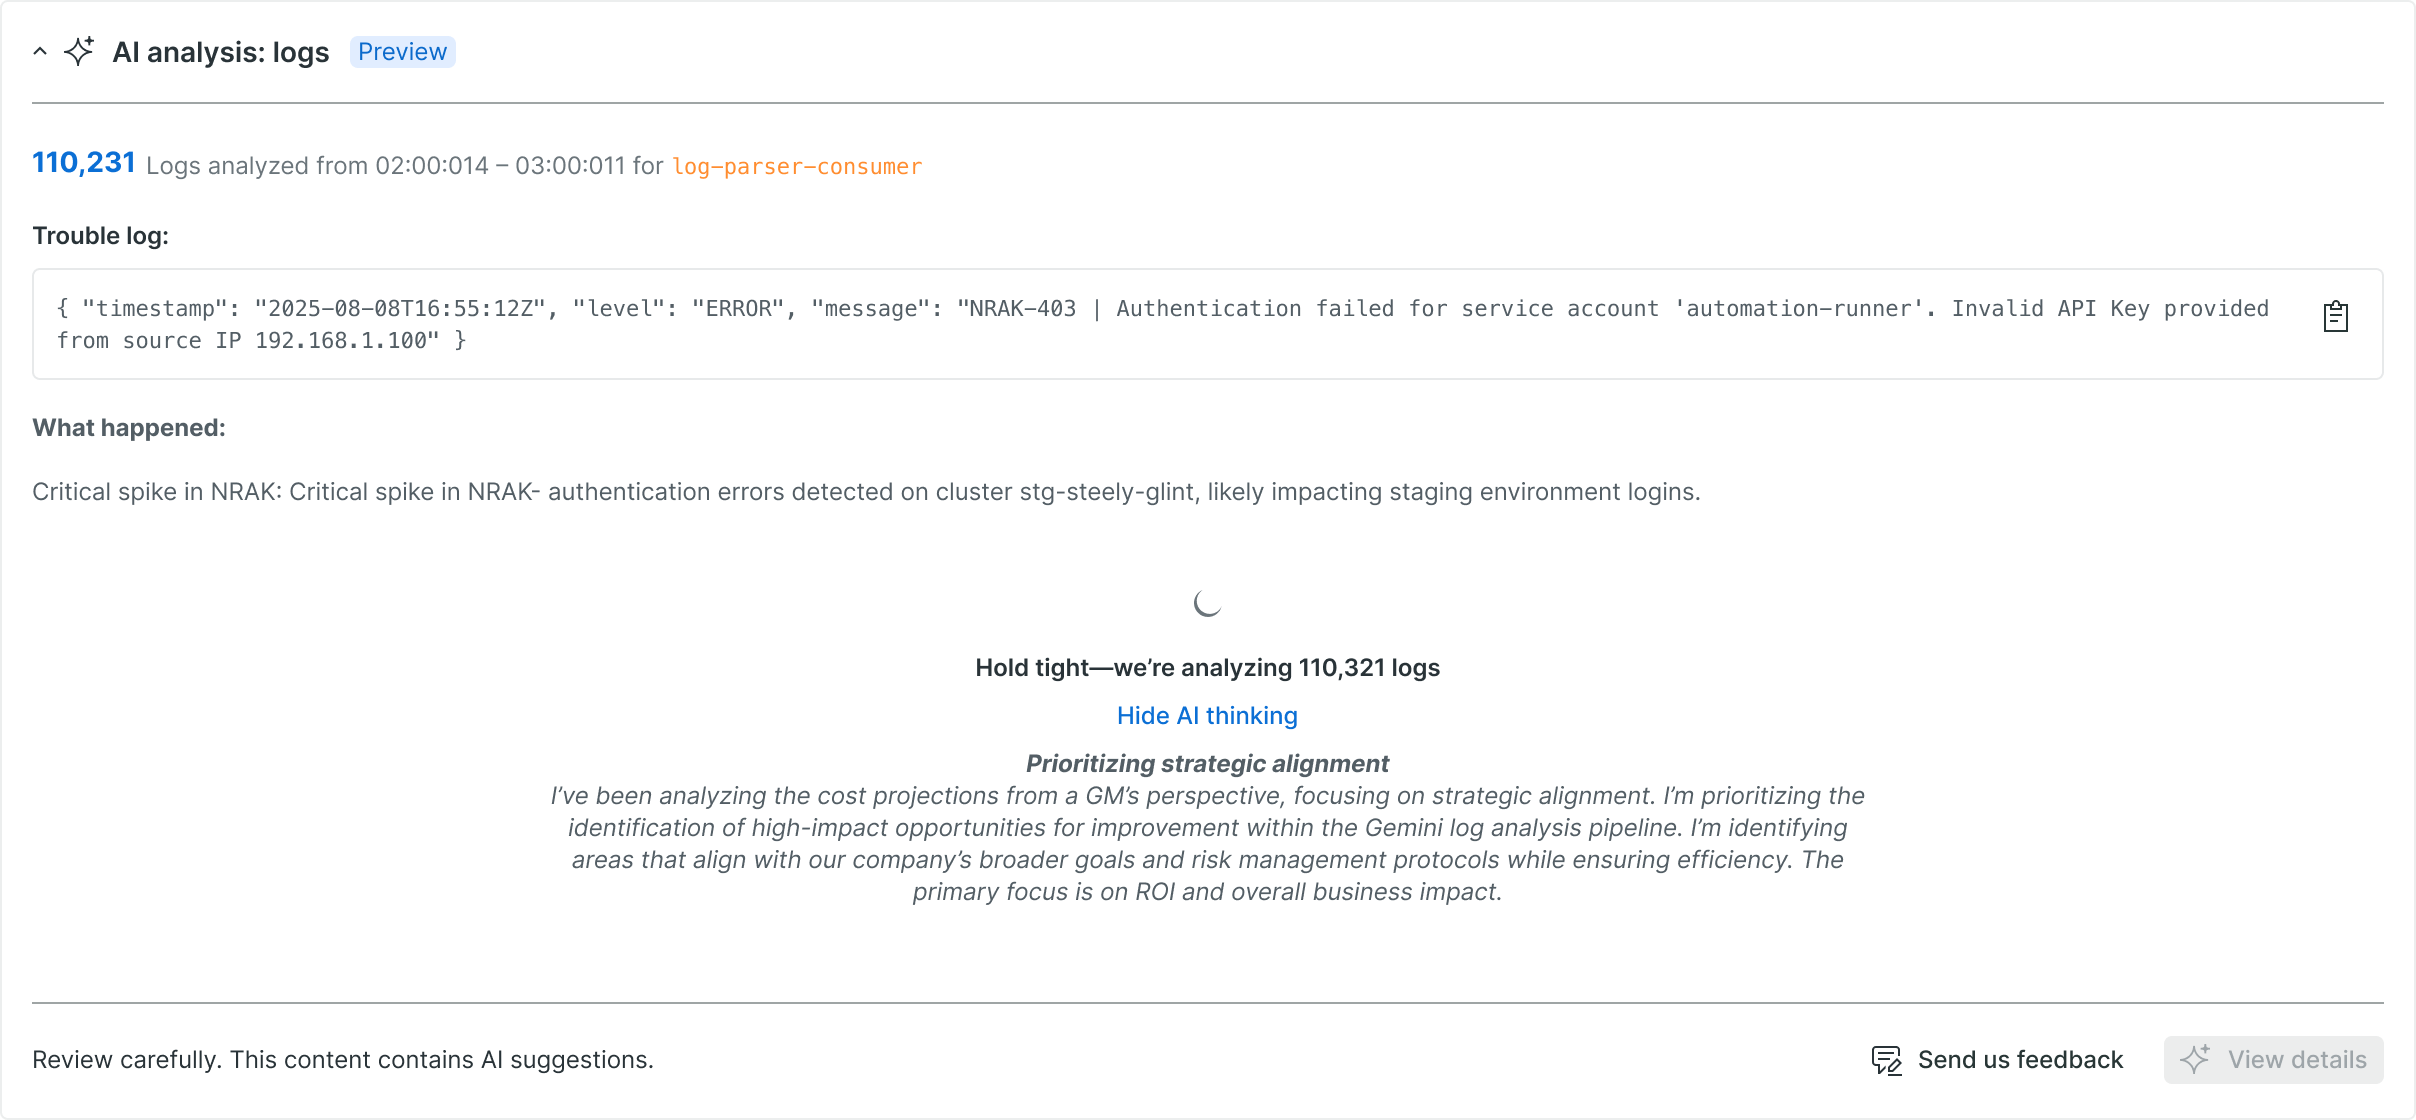
Plain-English Key Findings: A concise, one-sentence theory of the problem (ex. “It appears a NullPointerException in the checkout-service is causing a spike in failed transactions.”)
Key Error Patterns: The dominant error messages and their frequency
Anomalous Insights: What is different in this range than normal?
Impacted Systems: The primary applications, services, or pods involved
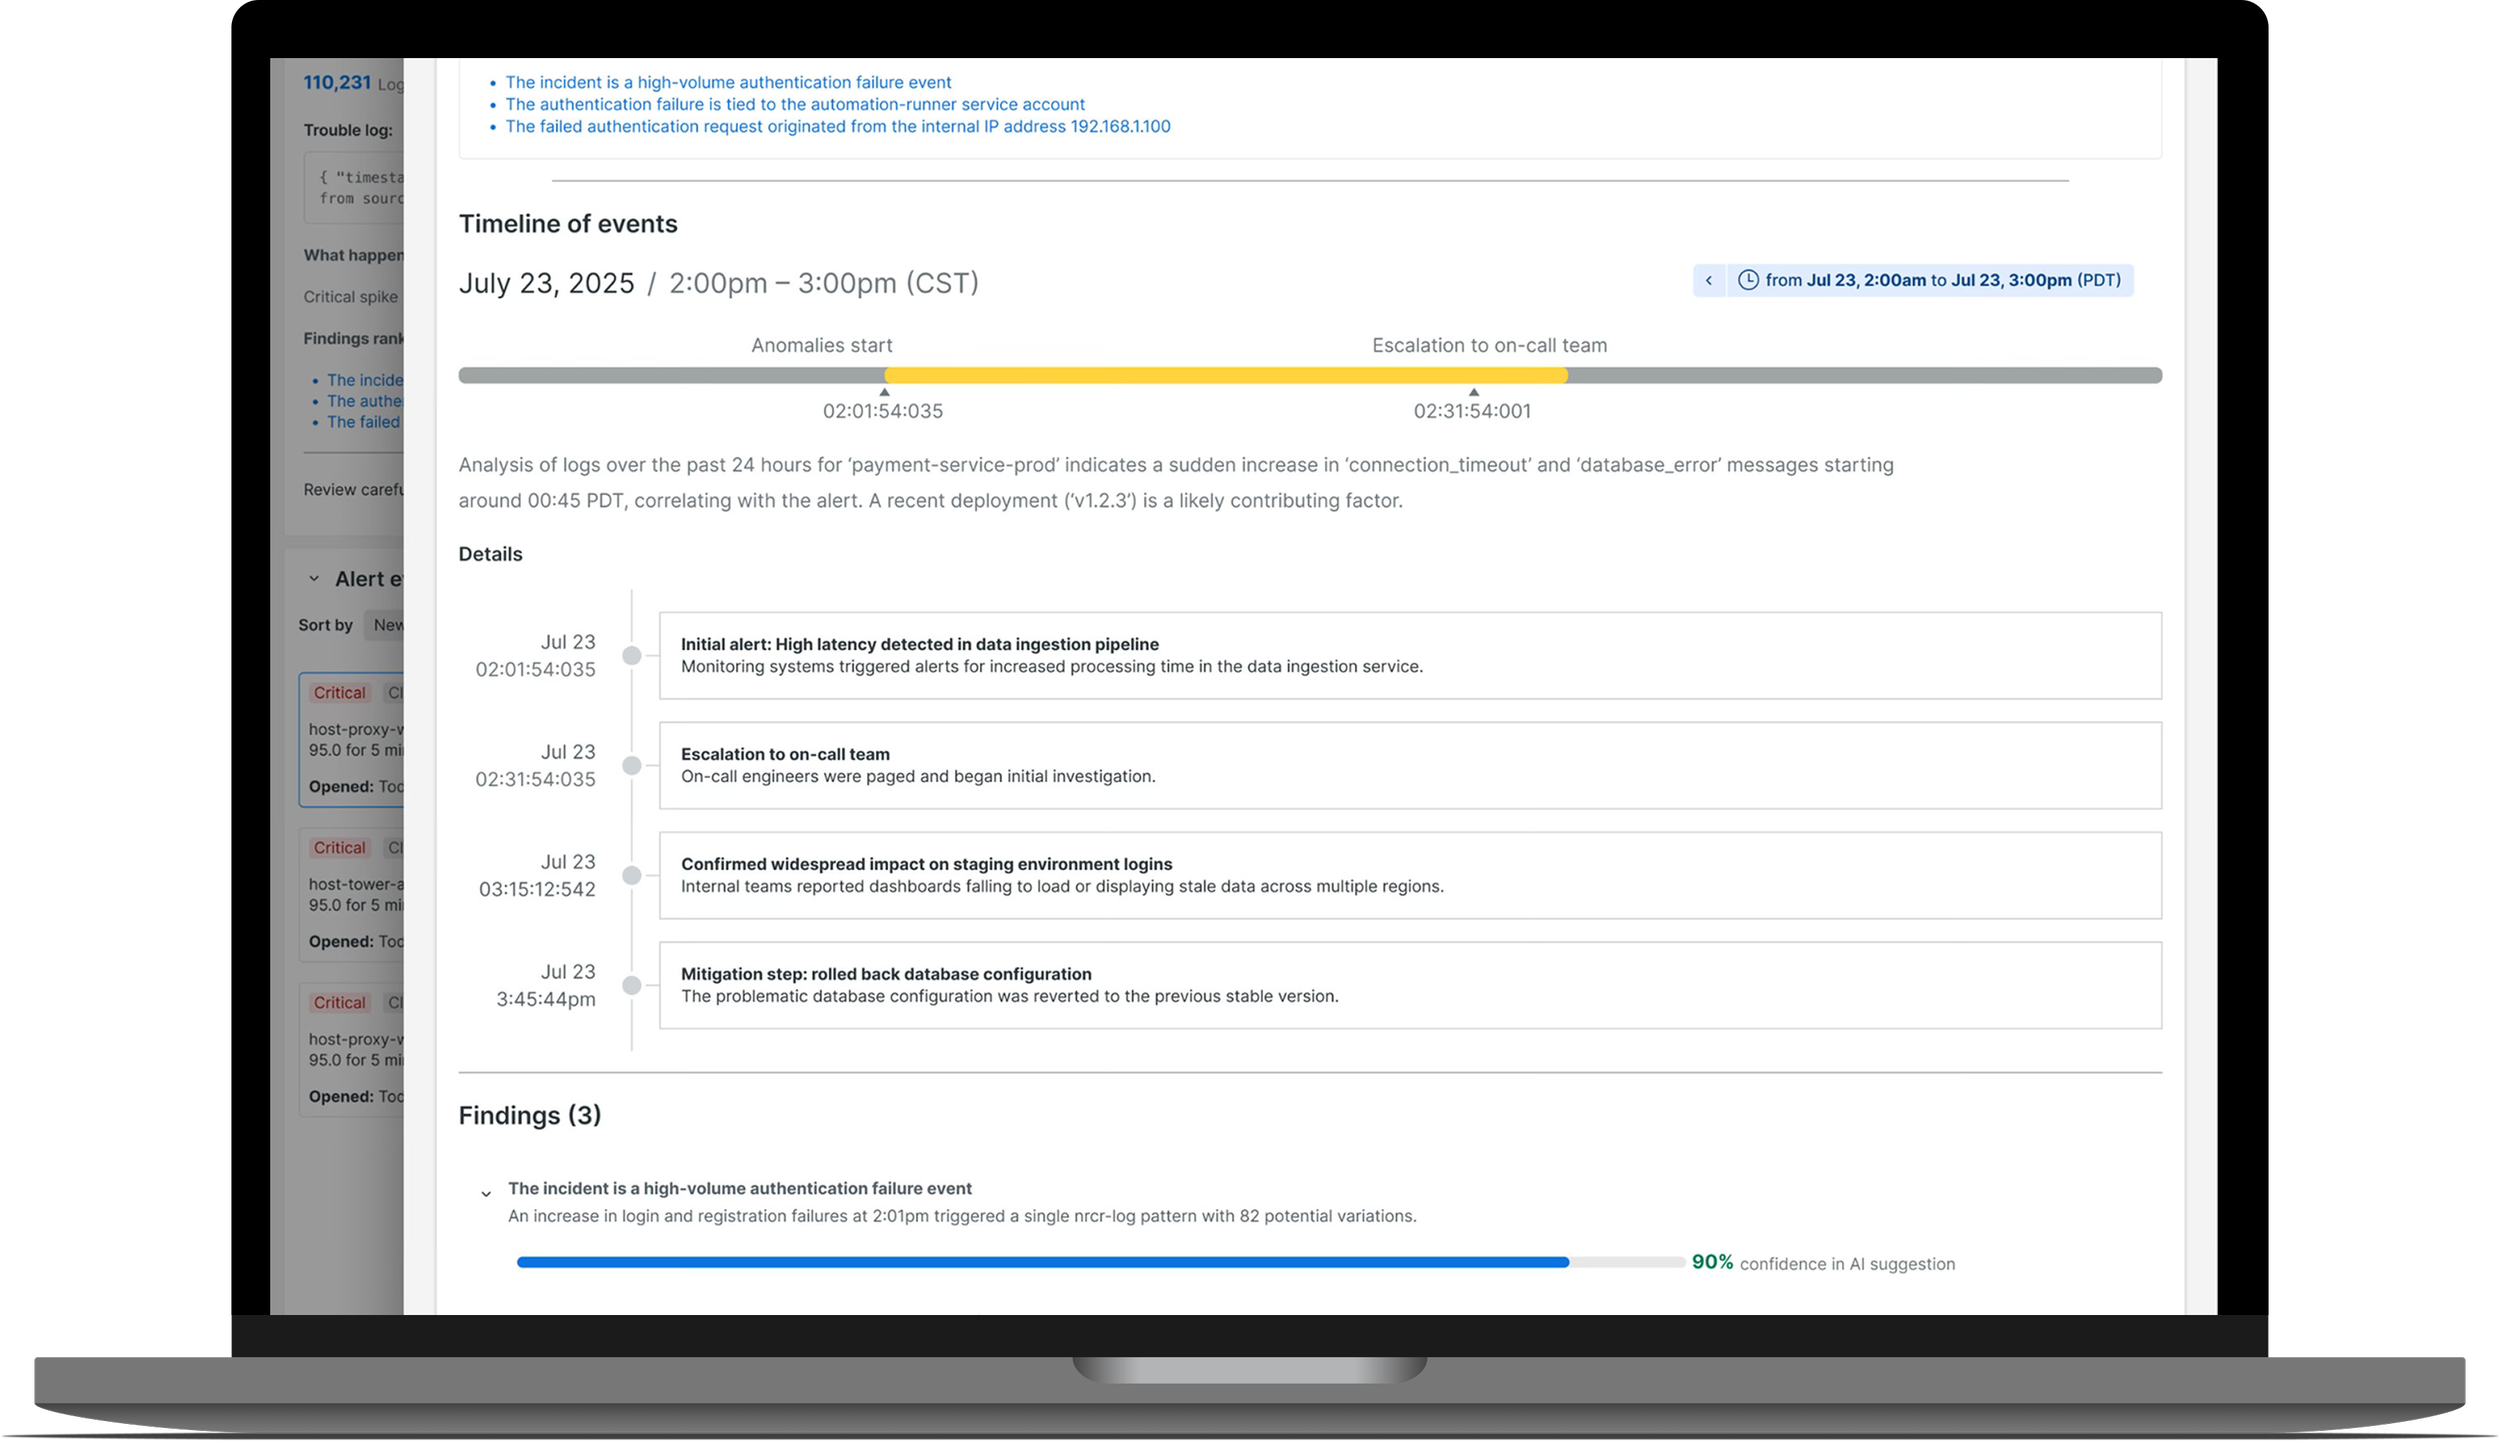
Anomaly Timeline: A confirmation of the spike in errors that triggered the alert
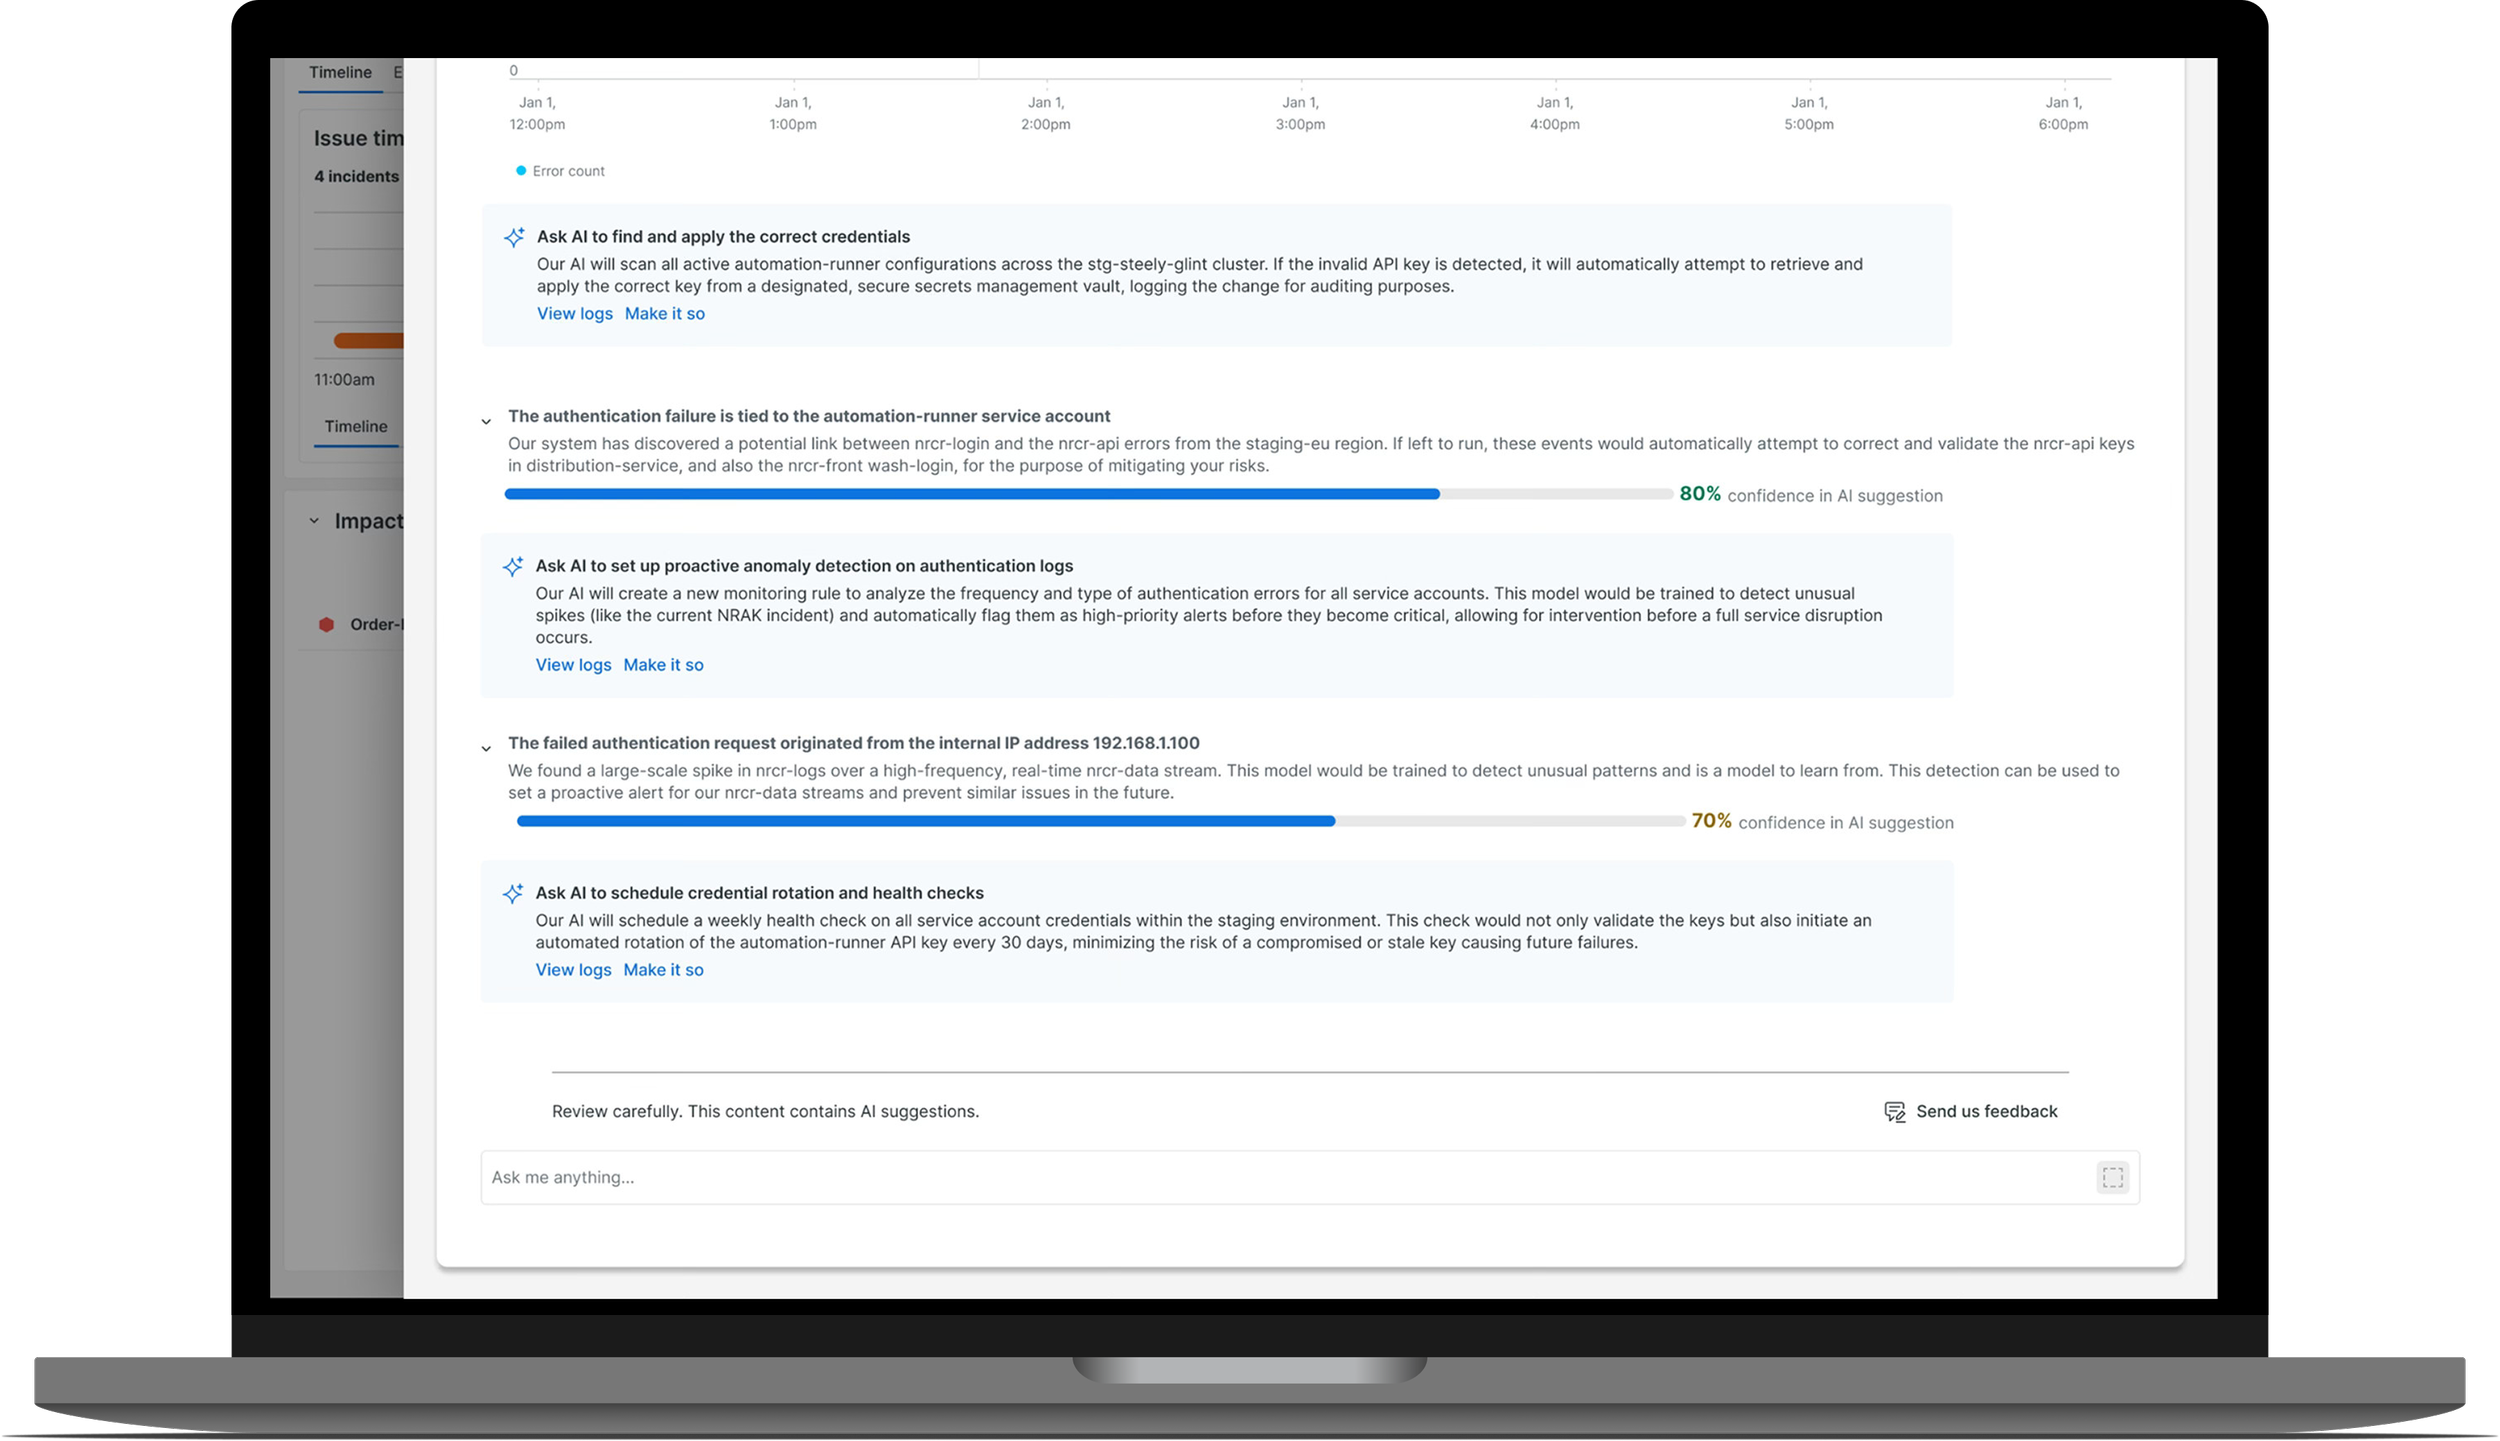
Guided Investigation:
The summary is an interactive launchpad. Each finding is an actionable UI element that guides the user’s next step.
Accelerated Resolution:
The analytical burden shifts from the SRE to the AI. The user is no longer a “data miner” but a “first responder” being fed critical intelligence. This dramatically accelerates the path to understanding the root cause, thus slashing MTTR
project scope & team
Design Team
Product Manager, Telemetry Data Platform
Lead Product Designer (myself)
UX Strategist
Content Designer
Communication & Cadence
Project duration: 3 months (Kick-off to Public Preview)
2x/weekly syncs between Lead Product Designer, Product Manager and UX Strategist
Research & Discovery: 7 user interviews (2 weeks)
Design & Iteration: 3 workshops (2 weeks)
Presentation to SVP of Product Design & XD team
Tools
Figma - Prototyping
Slack - Collaboration
Google Suite (Slides, Sheets, GMail) - Communication & Collaboration
Zoom - Collaboration